Analytics
On the Analytics Page, you can find insights on your players, Steam, and Discord.
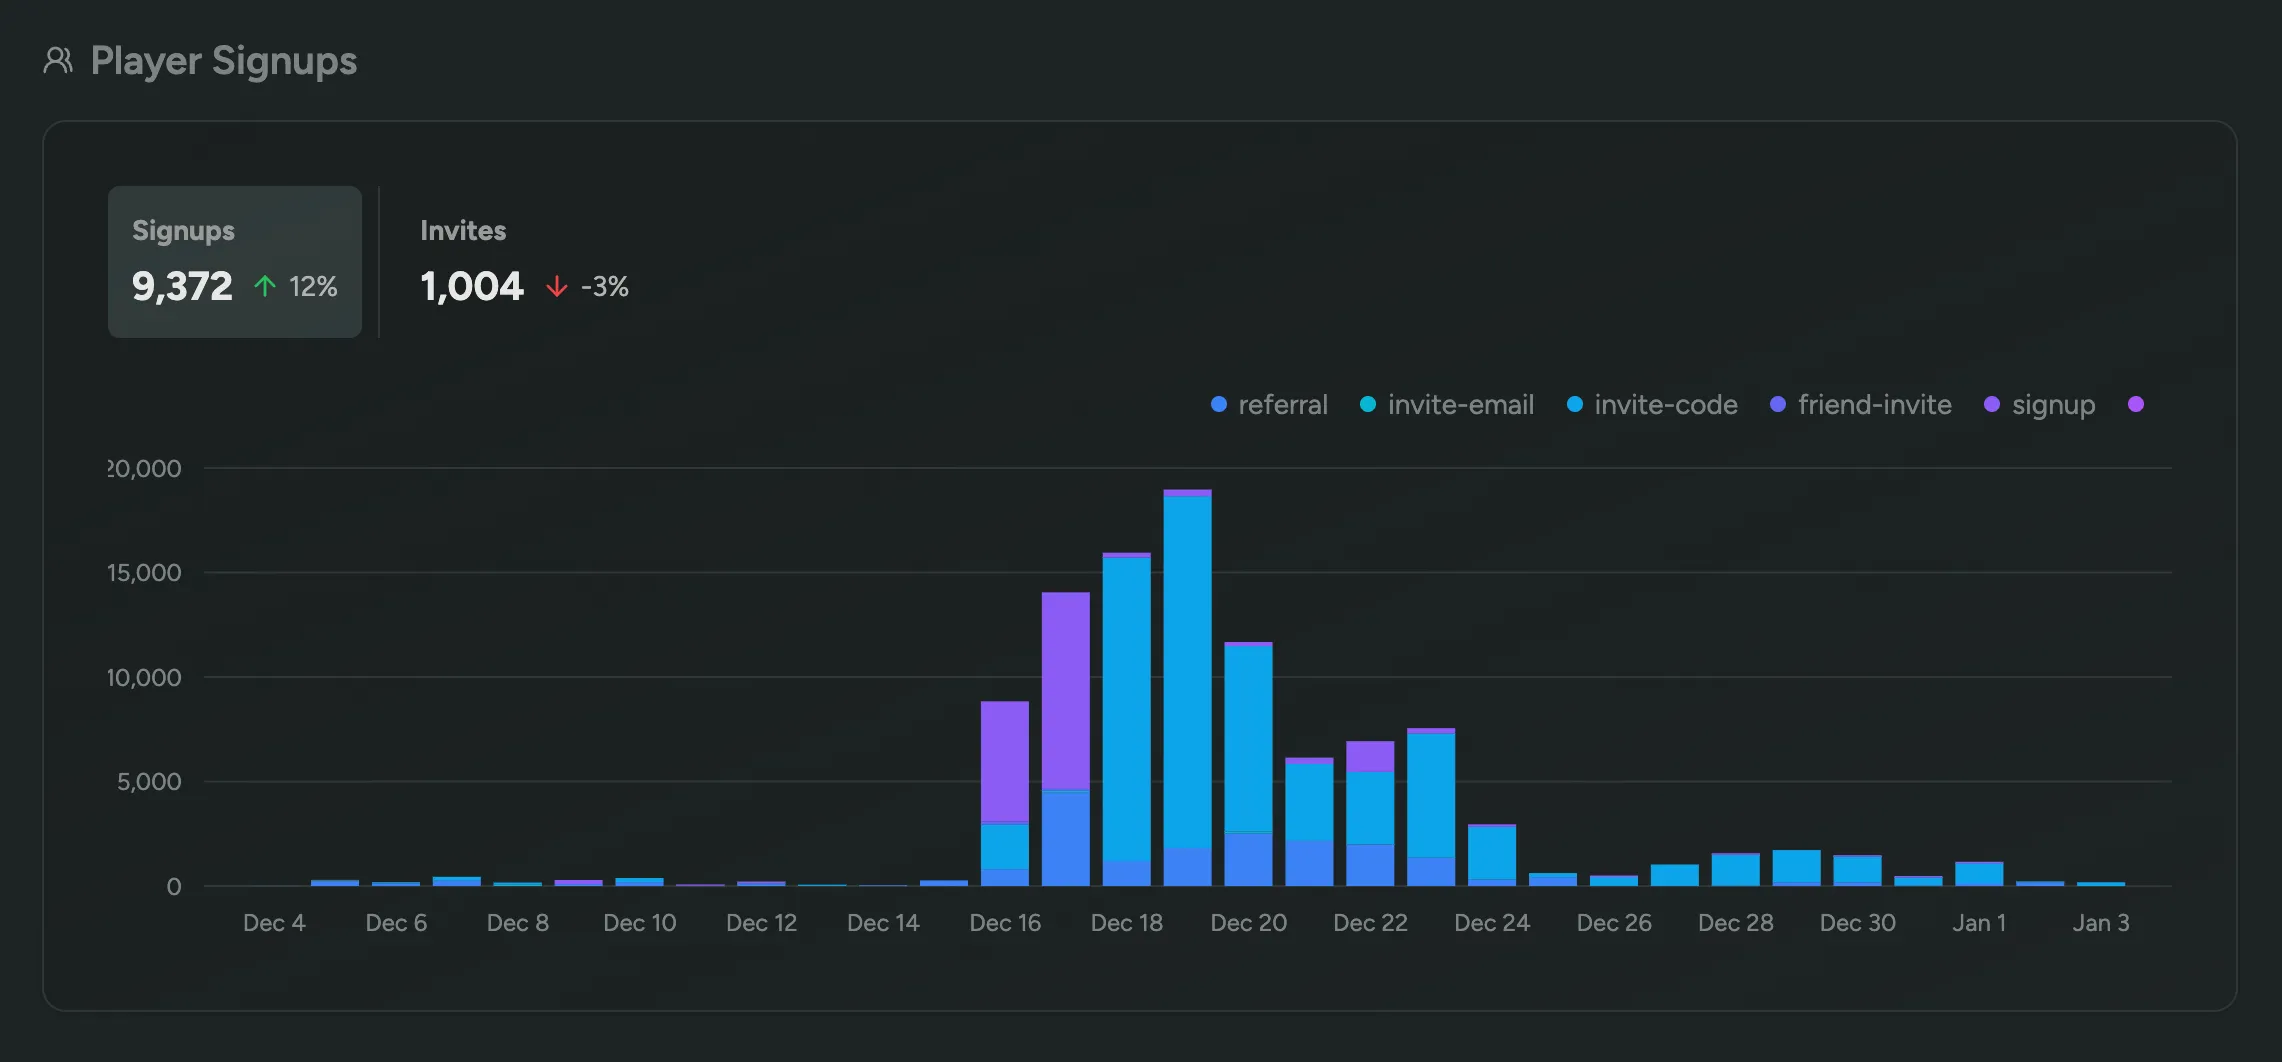
Player Signups
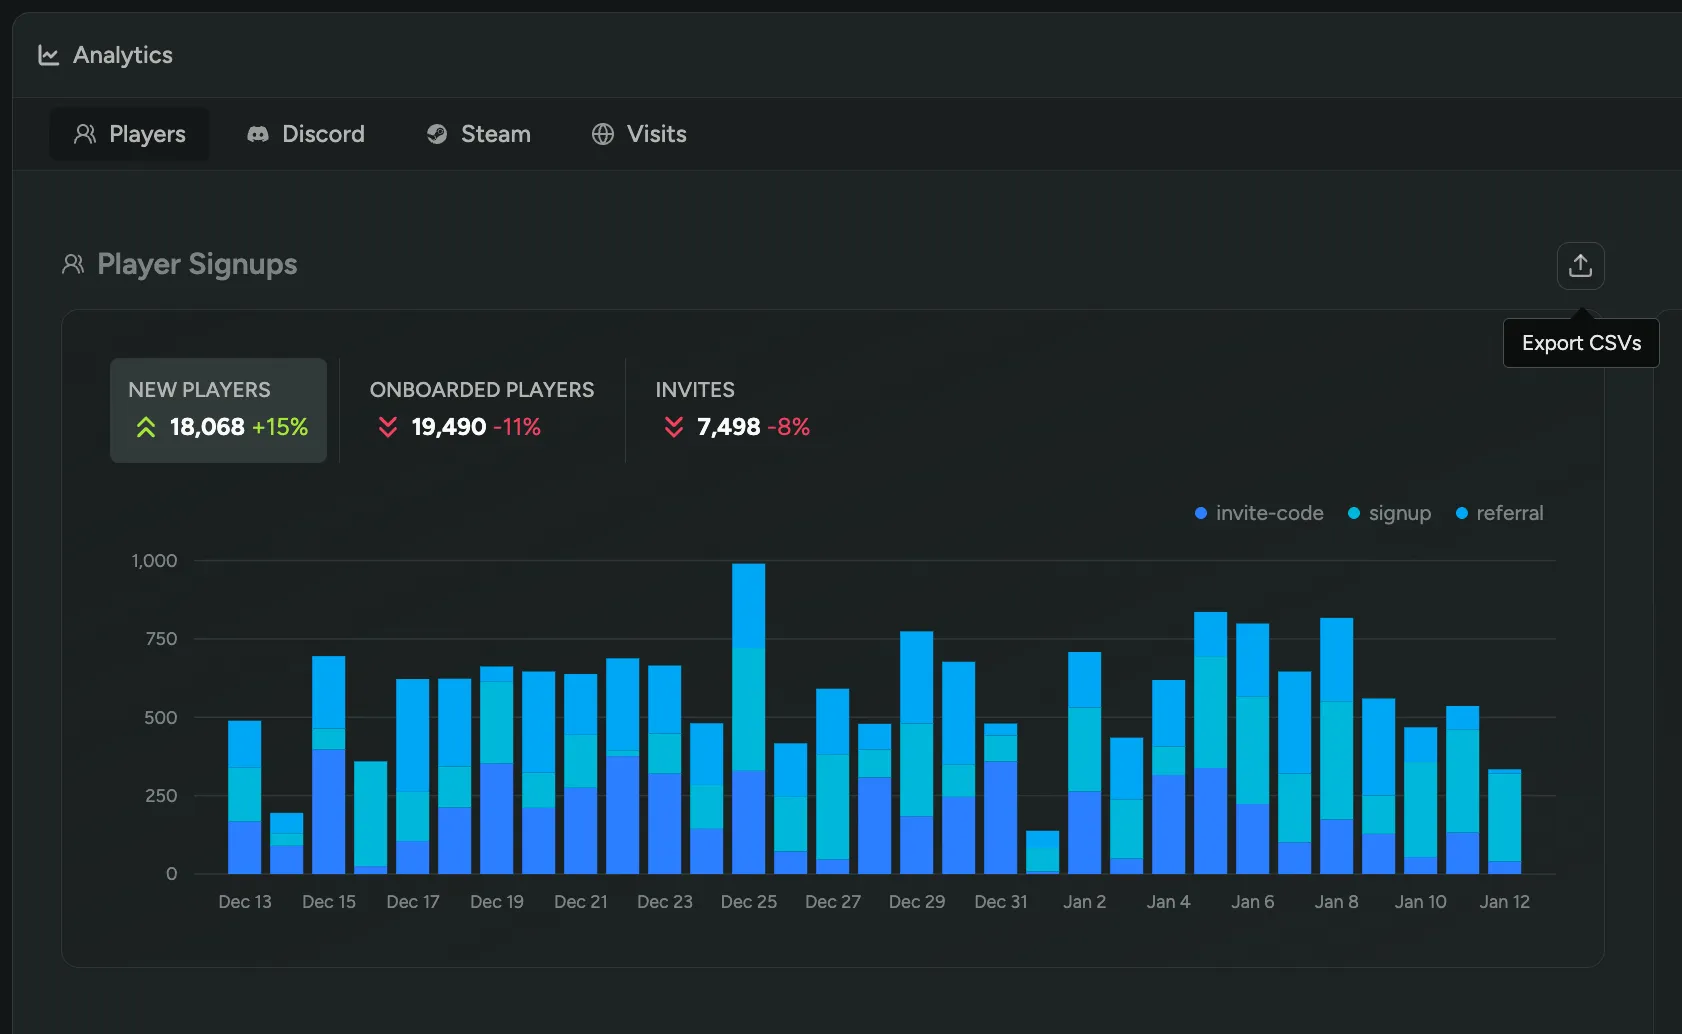
Section titled “Player Signups”See how many players have signed up for your playtest, and through which method (invite-code, friend invite, etc). Additionally, you can see which vanity invite codes were used the most.
Discord Activity
Section titled “Discord Activity”Install the Discord App to sync your Discord channels and get insights on your Discord activity broken down by channel. We’ll also show you a leaderboard of the most active members, in addition to a graph displaying the amount of unique active members.

Steam Playtime
Section titled “Steam Playtime”See how much time players have spent playing your game on Steam, including the total time played, avarage time played, and the amount of unique players. Learn More

Web Analytics
Section titled “Web Analytics”Discover the number of visitors to your waitlist and onboarding tool, as well as their origins.
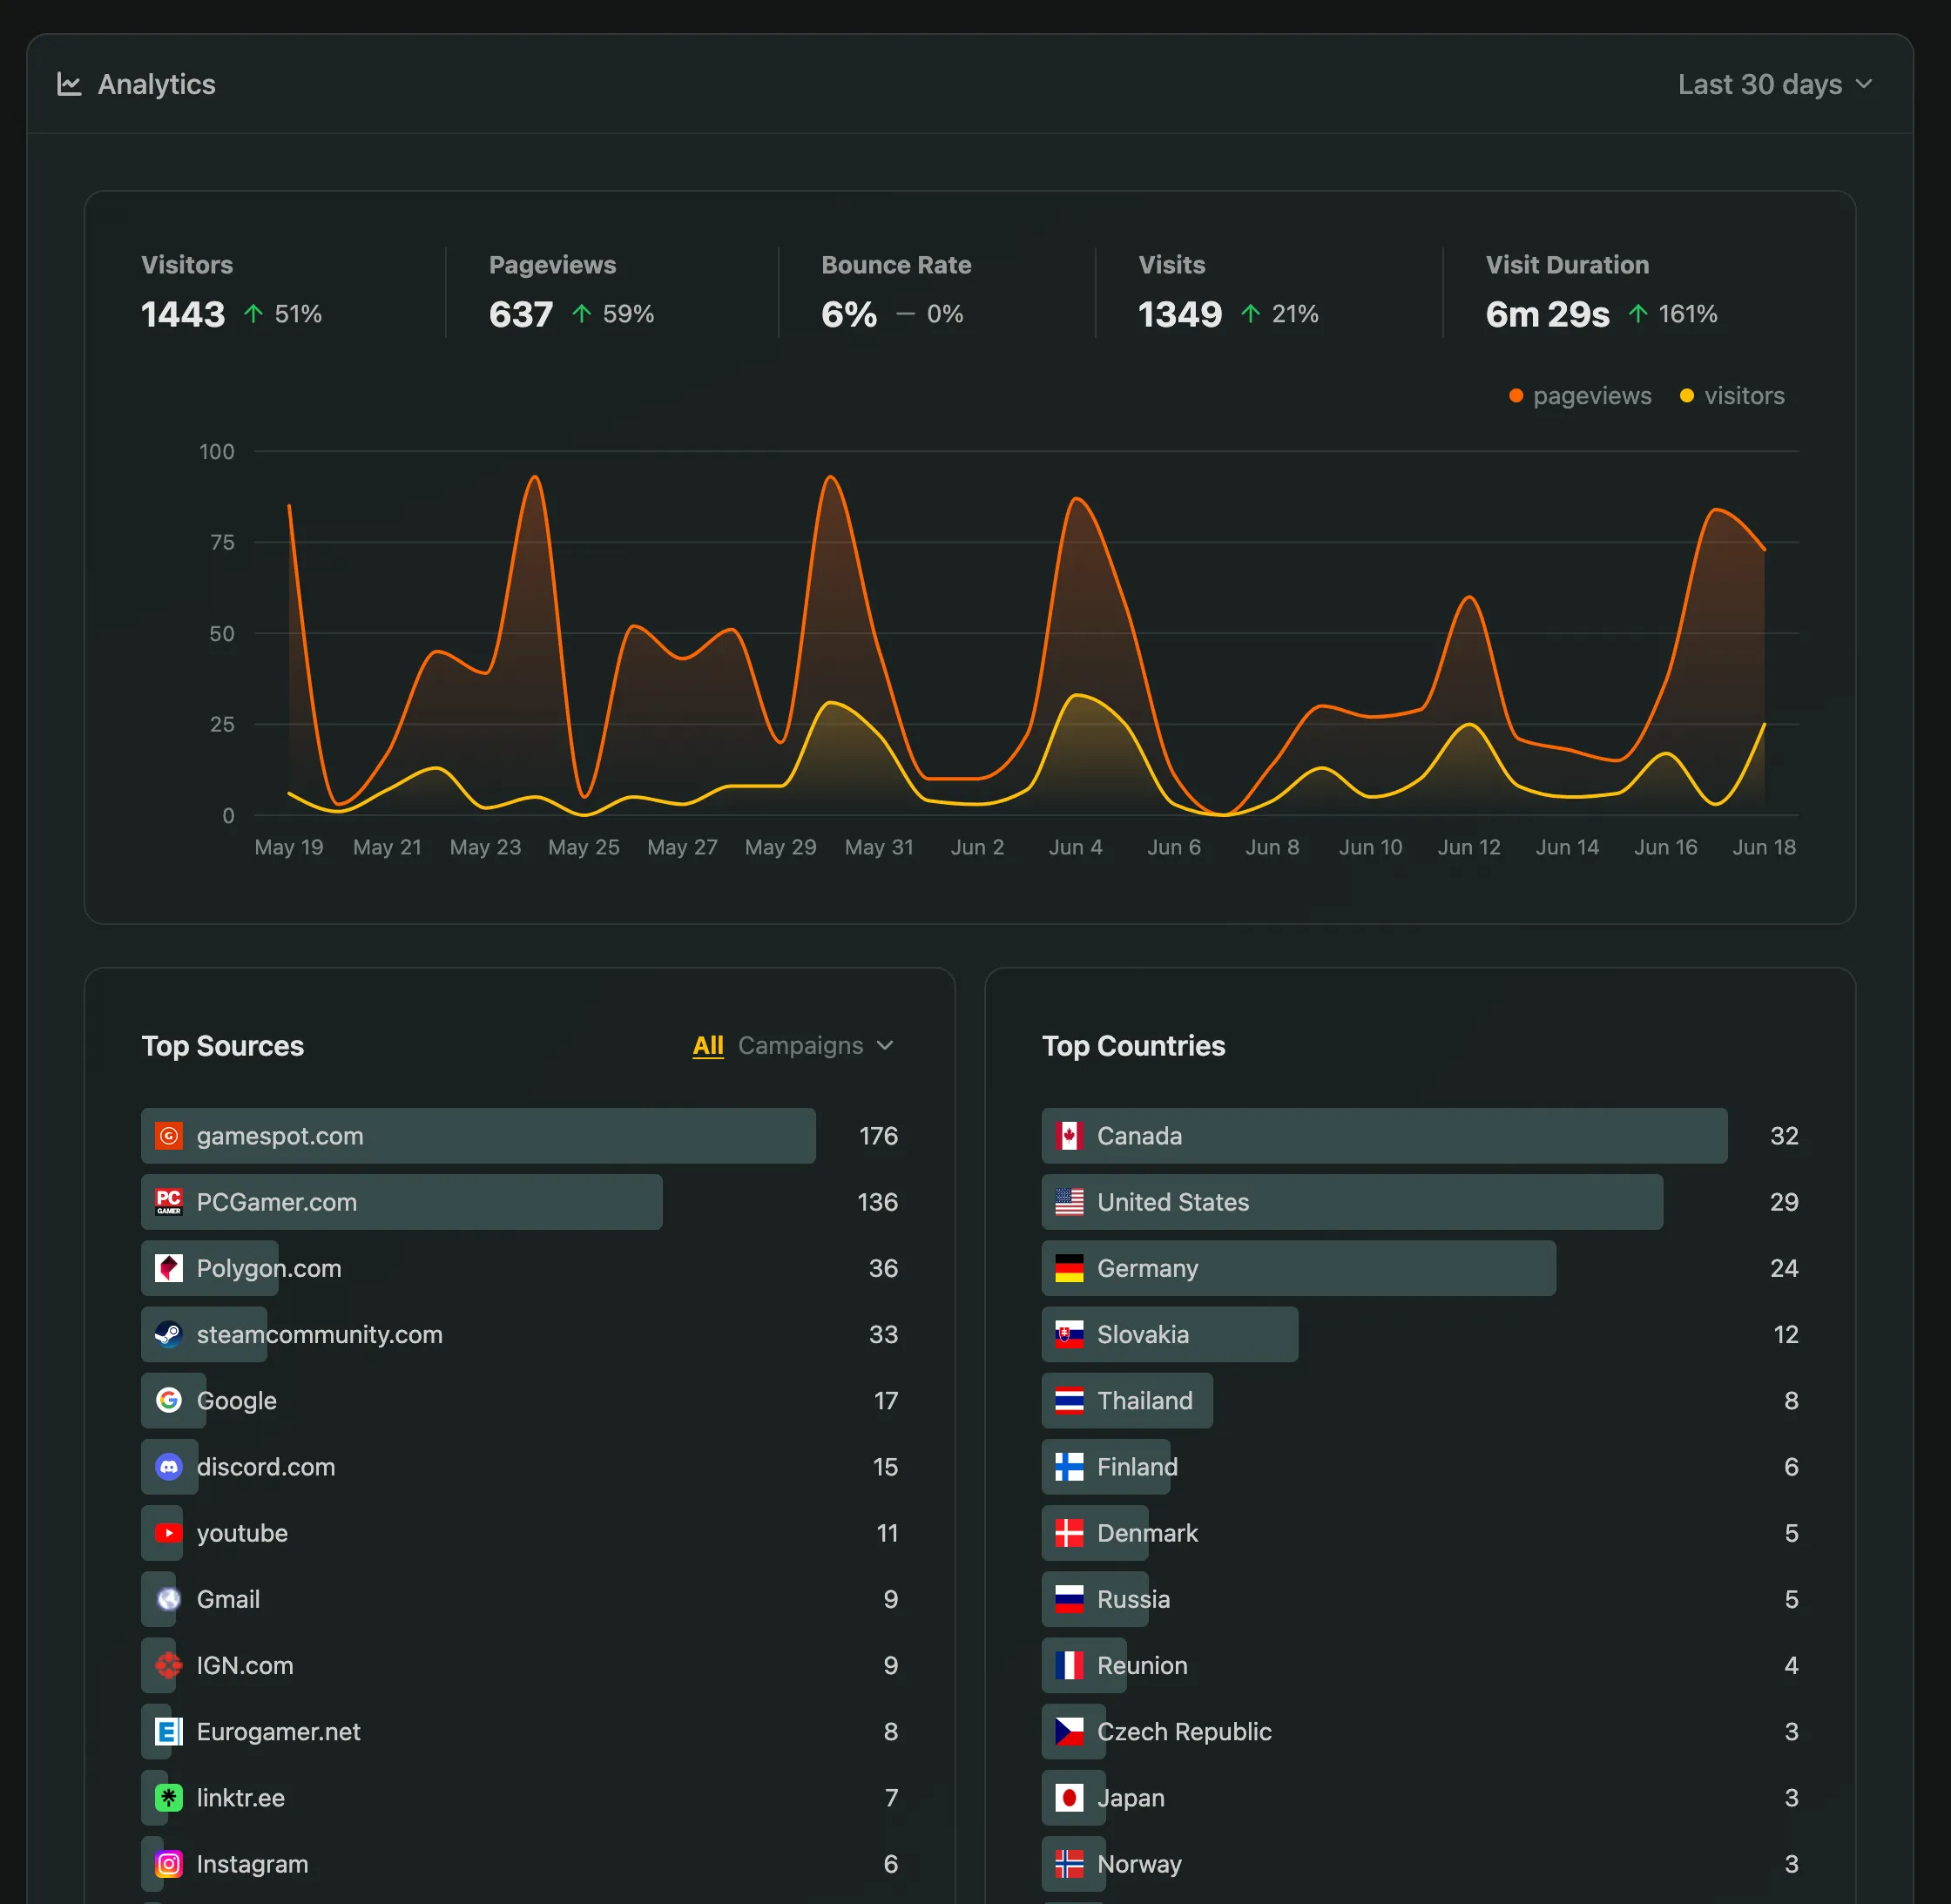
In your dashboard, you can find the analytics page featuring:
- Key Metrics such as Visitors, Pageviews, Duration, and their change compared to the previous period
- Top Referral Sources by visitor count, allowing grouping by Referrer, UTM Campaign parameters, and more
- Top Countries based on visitor count for the chosen period
- Period Selector to access statistics for today, this week, month, half-year, or year.
Retention
Section titled “Retention”Track how your players are engaging with your game over time using data collected directly from the game client via the FirstLook SDK. Use the date picker to select a time range — the graphs will automatically bucket values by hour, day, or week depending on the window you’ve chosen.
Players
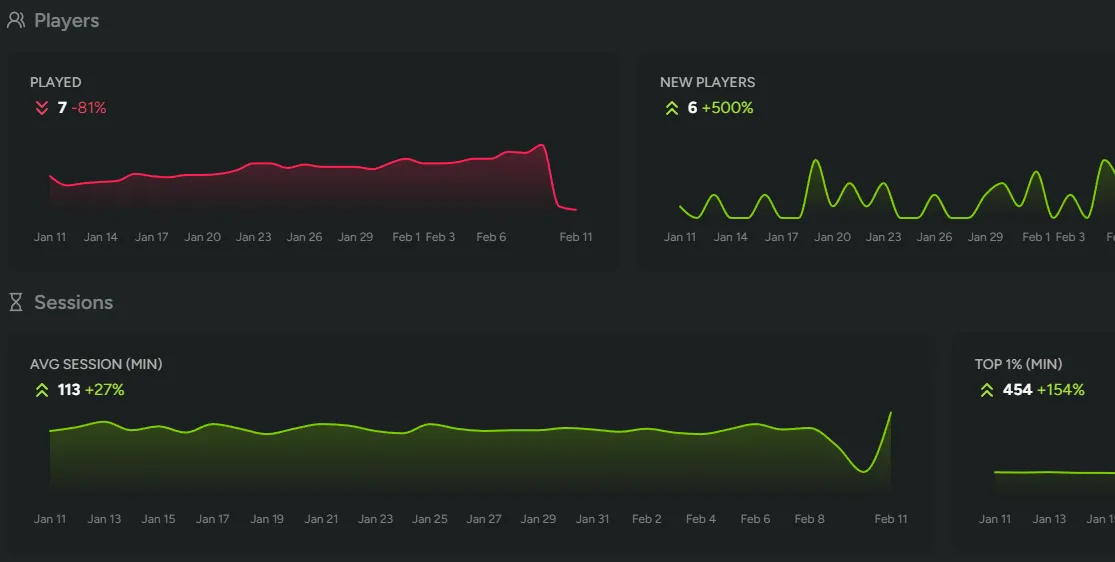
Section titled “Players”Get a high-level view of your player population across the selected time range:
- Played - The number of unique players who launched a session.
- New Players - First-time players who were seen for the first time during this period.
- Total Players - Your cumulative player count.
Sessions
Section titled “Sessions”Understand how long players are spending in your game per session:
- Average Session Length - The mean session duration in minutes across all players.
- Top 1% Session Length - How long your most engaged players are playing, measured by the 99th percentile session duration.
Retention
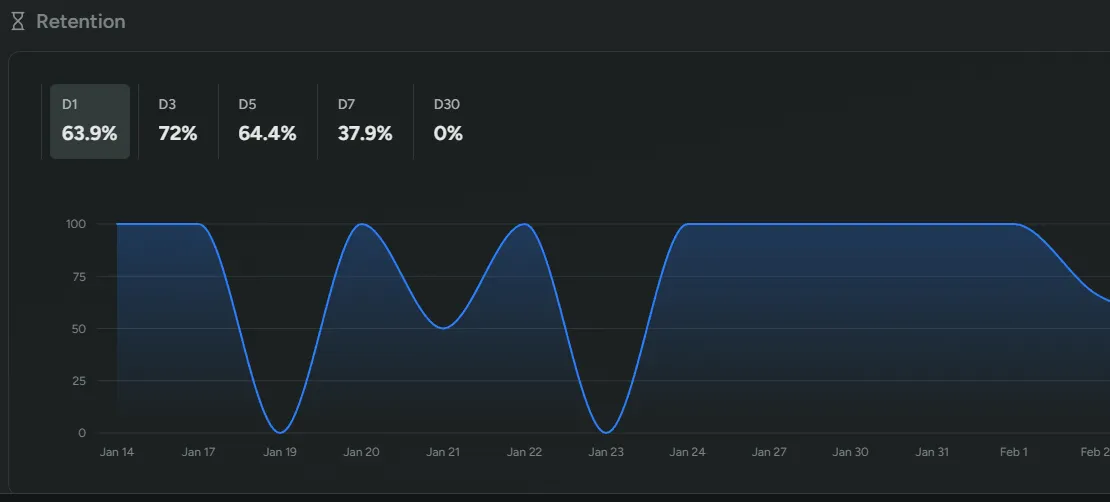
Section titled “Retention”Measure how well your game brings players back with classic day-based retention:
- Classic Retention - D1, D3, D5, D7, D30.
Classic retention tracks the percentage of a cohort that returns on a specific day after first playing. For example, D1 retention tells you how many players came back the very next day, while D30 gives you a picture of long-term stickiness. These metrics are especially useful for evaluating onboarding effectiveness and sustained engagement.
Events
Section titled “Events”Monitor custom gameplay events that your studio has instrumented through the FirstLook SDK. Each event consists of two parts:
- Name - A dot-separated identifier following the pattern
<category>.<event-name>, such asmatch.killsorstore.purchase. - Value - A non-zero integer representing a count or quantity.
Events are charted individually and grouped by their category prefix, making it easy to compare related metrics at a glance. For details on sending events from your game client, see the SDK Setup guide.
Duration Events
Section titled “Duration Events”Track how long in-game activities take using duration events from the FirstLook SDK. While counter events record that something happened, duration events measure how long it lasted — match length, time spent in a menu, loading times, or any other timed span.
Each duration event is defined by:
- Name - A dot-separated identifier following the same
<category>.<event-name>pattern as counter events, such asmatch.roundormenu.loadout. - Start / End - The SDK records timestamps when you call
StartDurationEventandEndDurationEvent. FirstLook calculates the elapsed time automatically.
Duration events are displayed on the Events tab with three graphs per event:
- Count - How many times the event was completed in each time bucket.
- Average Duration (min) - The mean duration in minutes across all players.
- Top 1% Duration (min) - The average duration among the top 1% longest instances, measured by the 99th percentile. This highlights your most extreme outliers — useful for spotting unusually long matches, stalled loading screens, or other activities that may warrant investigation.
Like counter events, duration events are grouped by their category prefix. Use the date picker to select a time range, and the graphs will automatically bucket by hour, day, or week. For implementation details, see the SDK Setup guide.
Export Analytics Data
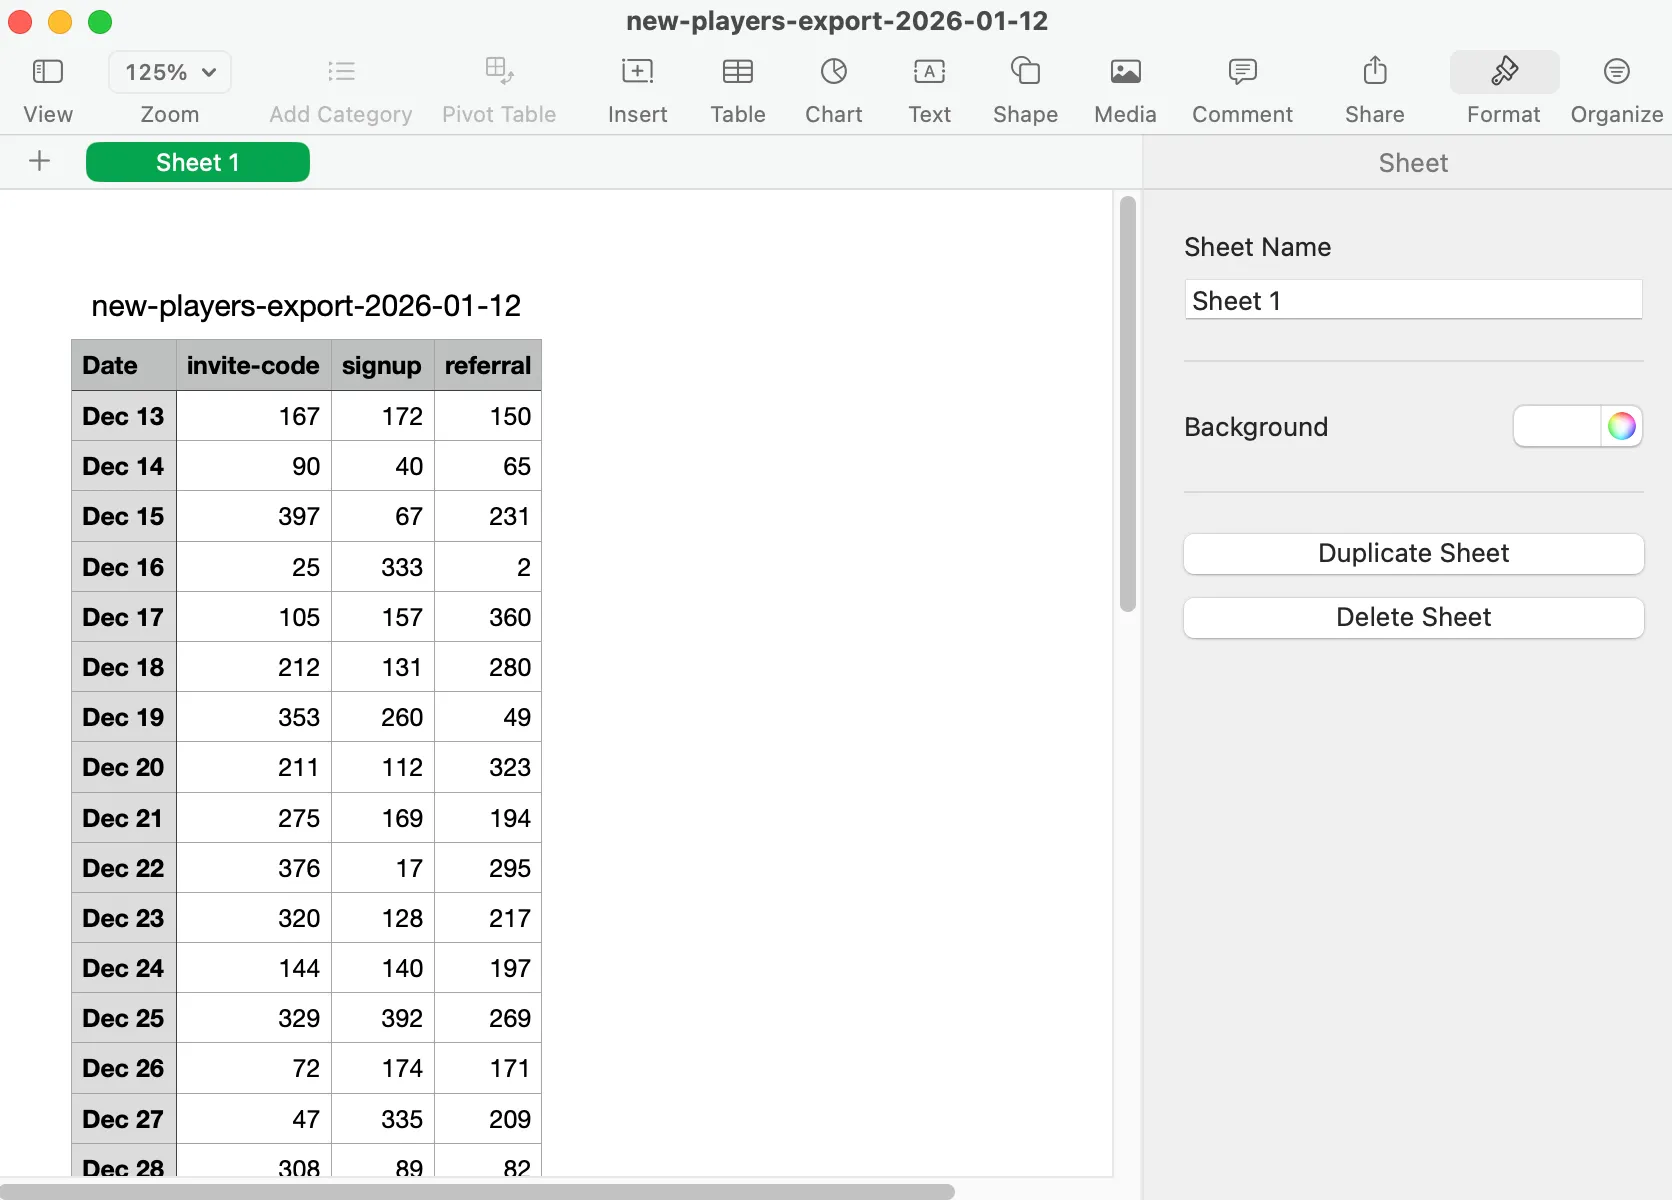
Section titled “Export Analytics Data”You can export any analytics graph as a CSV. Simply click on a graph’s export button to download the underlying data for player signups, Discord activity, Steam metrics, and web statistics.
UTM Parameters
Section titled “UTM Parameters”You can use UTM parameters to track the effectiveness of your marketing campaigns. UTM parameters are tags that you add to a URL. When someone clicks on a URL with UTM parameters, those tags are stored in our analytics. This way you can see which campaigns are driving traffic to your onboarding page.
Aside from the standard UTM parameters, we also store the ‘Referrer’, which is the URL of the page that linked to your onboarding page.
Both the UTM parameters and the Referrer are also stored on the player profile when they sign up for your playtest.
Example URL with UTM parameters:
https://yourgame.firstlook.gg/?utm_source=twitter&utm_medium=social&utm_campaign=launchPrivacy
Section titled “Privacy”We are using Plausible Analytics to track the usage of the onboarding page and waitlist. Plausible is a privacy-friendly alternative to Google Analytics. It doesn’t use cookies and is fully compliant with GDPR, CCPA and PECR. This way we do not need to show a cookie banner to your visitors so they can focus on signing up for your game.